MotifExpress
MotifExpress1 is a tool for rapidly discovering cis-regulatory motifs by correlating sequence to expression data. It will discover motifs whose presence is best correlated with changes in genome-wide gene expression from a control state to an experimental state. It uses expression data as measured by microarray or RNA-seq, and repeatmasked sequence data from regions relevant to the genes whose expression has been measured.
-Installing MotifExpress
MotifExpress was designed for win32 systems, and requires a number of prerequisites to function. You should download them first if you do not have them:
- Python 2.5+
- R 2.6.2
- abind — download from inside R
- impute — download from BioConductor
- samr — download from BioConductor
Download MotifExpress here.
Correlation Pursuit
Correlation Pursuit (COP) is the package for selecting variables for SDR models via correlation pursuit. Unlike linear stepwise regression, COP does not impose a special form of relationship (such as linear) between the response variable and the predictor variables. The COP procedure selects variables that attain the maximum correlation between the transformed response and the linear combination of the variables. Various asymptotic properties of the COP procedure are established and, in particular, its variable selection performance under a diverging number of predictors and sample size is investigated. The excellent empirical performance of the COP procedure in comparison with existing methods is demonstrated in “Correlation pursuit: forward stepwise variable selection for index models”.
Downloads:
Smoothing Spline Clustering
What is Smoothing Spline Clustering?
Smoothing Spline Clustering is a statistical method for clustering time-series gene expression data. In particular, Smoothing Spline Clustering is useful for clustering genes in microarray experiments performed over several time points, for example, over the course of development, a drug treatment, or other temporally based experiments.
What can Smoothing Spline Clustering tell me?
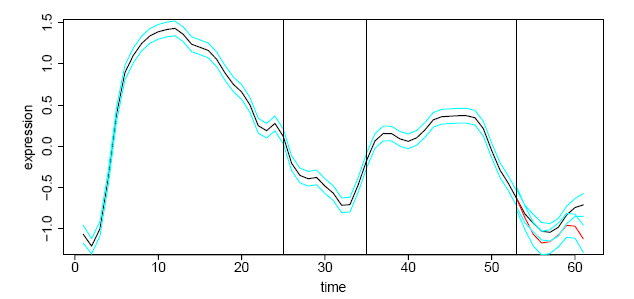
Smoothing Spline Clustering provides clusters of similarly expressed genes using a statistically rigorous, biologically based, data-driven method. Importantly, SSC provides the number of gene clusters in a given dataset without an a priori specification of the genes that belong to each cluster, a mean curve for each cluster describing the average expression profile of each cluster, and associated 95% confidence bands.
Example of an SSC cluster from D. melanogaster developmental data 1 showing mean expression curve and 95% confidence bands
Why Use Smoothing Spline Clustering?
The big advantage of Smoothing Spline Clustering over other clustering algorithms is that you do not have to specify a priori the number of clusters in your dataset or specify the expected functional forms (curves) of genes in the data. SSC achieves this by modeling the natural properties of gene expression over time, taking into account gene-specific differences in gene expression within a cluster of similarly expressed genes, the effects of experimental measurement error, and missing data. Furthermore, SSC provides a visual summary of each cluster’s gene expression function and goodness-of-fit as shown above.
Additionally:
- SSClust is easy to install and use.
- SSClust is free and open-source.
- You don’t have to sign up to get it.
- It’s published in a peer-reviewed journal.
Availability
- SSClust is freely available as a stand-alone package utilizing R
- SSClust is free and open-source academic software released under the GNU General Public License.
Download
- SSClust3.1
Running SSClust
- SSClust is run from the R command line by typing:
Note: The master control text file SSClust.R must be edited before running SSClust.It includes the location of your input data, number of clusters, number of RCEM chains to run, and RCEM threshold.SSClust is run repeatedly, each time increasing the number of clusters specified, until a minimum BIC score is achieved. For further details consult the SSClust Manual and Ma et al. 2006.